Linear Regression with python and Scikit-learn
Scikit-learn is a wonderful software package for performing various computations in the field of machine learning. Let us consider the calculation of the linear regression.
An equation Simple Linear Regression (SLR) have a view:
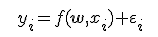
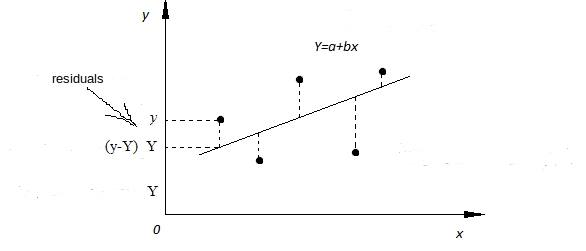
SLR models also include the errors in the data or residuals (y - Y). Residuals are basically the differences between the true value of y and the predicted/estimated value of Y. In a regression model we are trying to minimize these errors, can say, that we are trying to find the “line of best fit” — the regression line from the errors would be minimal.
Let's go to the code
All the code for this article can be found here.
for test data we take a file test_dataset.csv, which describes the relationship between work experience and annual salary
import necessary libraries:
import pandas as pd
import numpy as np
import matplotlib.pyplot as pl
load dataset:
dataset = pd.read_csv('test_dataset.csv')
dataset.shape
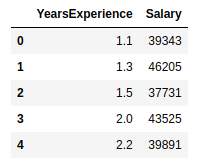
dataset.head()
show the first 5 records from our dataset, the output will be like this:
dataset.describe()
show statistical details of the dataset
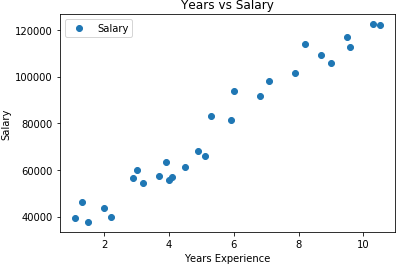
dataset.plot(x='YearsExperience', y='Salary', style='o')
plt.title('Years vs Salary')
plt.xlabel('Years Experience')
plt.ylabel('Salary')
plt.show()
printing our dataset, the output will be such:
take values without headings:
X = dataset.iloc[:, :-1].values
y = dataset.iloc[:, 1].values
distribute 80% of the data to training set while 20% of the data to test set:
from sklearn.model_selection import train_test_split
X_train, X_test, y_train, y_test = train_test_split(X, y, test_size=0.2, random_state=0)
train model:
from sklearn.linear_model import LinearRegression
regressor = LinearRegression()
regressor.fit(X_train, y_train)
make prediction:
y_pred = regressor.predict(X_test)
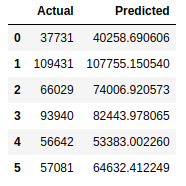
and compare prediction and actual value:
df = pd.DataFrame({'Actual': y_test, 'Predicted': y_pred})
df
Now we can look such table, which contains the actual values and our predictions
calculate the values:
from sklearn import metrics
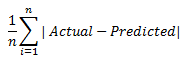
print('Mean Absolute Error:', metrics.mean_absolute_error(y_test, y_pred))
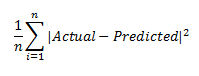
print('Mean Squared Error:', metrics.mean_squared_error(y_test, y_pred))
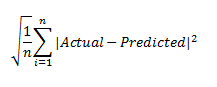
print('Root Mean Squared Error:', np.sqrt(metrics.mean_squared_error(y_test, y_pred)))
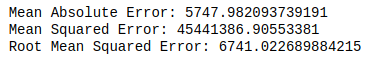
There is a wonderful article that describes the differences in errors.
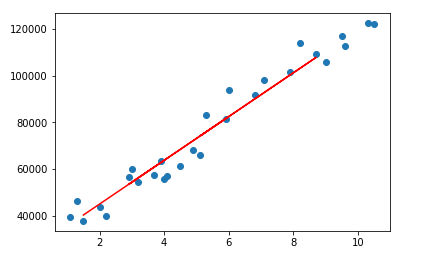
plt.scatter(X, y)
plt.plot(X_test, y_pred, color='red')
plt.show()
Multiple Linear Regression
Model for multiple linear regression is created similar to simple linear regression. The code you can find here
Post your comment